What is Financial Reports?
Money Manager's Financial Reports section turns your raw transaction data into meaningful, visual insights that help you understand exactly where your money comes from and where it goes. The Analytics screen presents income, expense, and transfer data as interactive pie and donut charts with percentage and value breakdowns by category. You can filter by date range, category, account, and income or expense type to zero in on the exact data you need. Drill down from overview totals to sub-category granularity, export your report as Excel or PDF, or send it directly by email — giving you full analytical power over your complete financial life.
See the Full Picture. From high-level pie charts to category-by-category breakdowns and filterable transaction lists — Financial Reports gives you every angle of your money in one beautifully presented, always accessible place.
Feature Highlights
See all the amazing capabilities in action:
Analytics Overview with Pie Chart
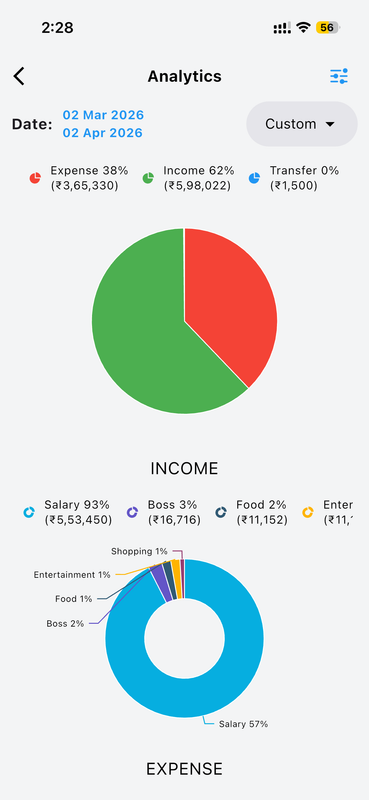
The Analytics screen opens with a powerful financial summary for your selected date range — displayed as a colorful pie chart showing the proportional split between Expense (38%, ₹3,65,330), Income (62%, ₹5,98,022), and Transfer (₹1,500). The chart instantly shows whether you earned more than you spent in the period. Below the main overview, the Income section breaks down your earnings by category — for example, Salary at 93% (₹5,53,450), Boss at 3% (₹16,716), and Food at 2% (₹11,152) — each represented in a detailed donut chart. This combined view is ideal for a quick, comprehensive financial health check at any custom date range you select.
Income & Expense Category Breakdown
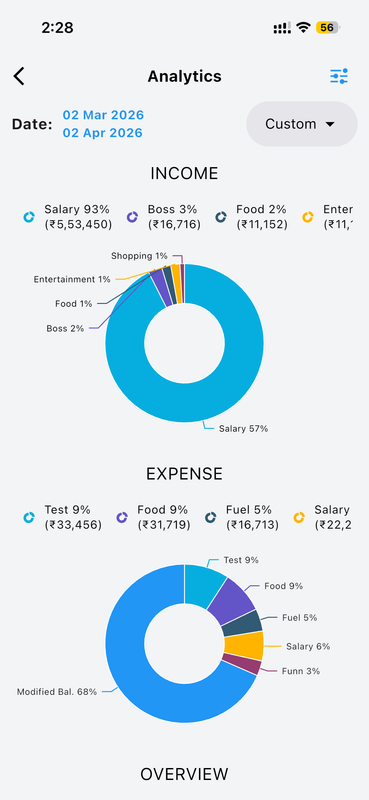
Scrolling down the Analytics screen reveals separate Income and Expense donut charts with precise percentage and value labels for every category. The Income donut highlights your dominant earning sources while the Expense donut exposes your spending distribution across categories like Test (9%, ₹33,456), Food (9%, ₹31,719), Fuel (5%, ₹16,713), Salary (6%), and more. Each segment is labeled directly on the chart with its percentage, and a legend below lists the exact rupee amounts for every category in the period. This dual-chart view makes it effortless to compare where your money comes from versus exactly where it is being spent across any selected time range.
Full Overview Donut Chart
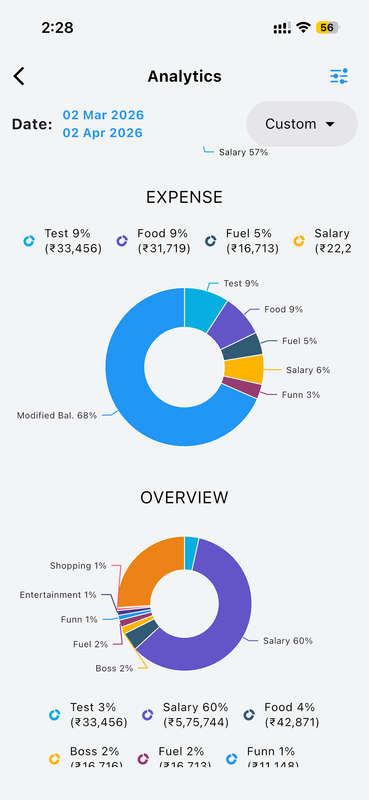
The Overview section at the bottom of the Analytics screen presents a combined donut chart that blends all transaction categories — both income and expense — into one unified circular visualization. This gives you a holistic view of your complete financial activity for the period, showing proportions like Salary at 60%, Modified Balance at 68%, Food at 4%, Fuel at 2%, Boss at 2%, and others. Exact currency values are listed below the chart alongside percentages for every slice. This 360-degree financial snapshot is especially useful when you want to understand the overall composition of all your money flows and see which categories truly dominate your financial life over any period.
Sub Category Report
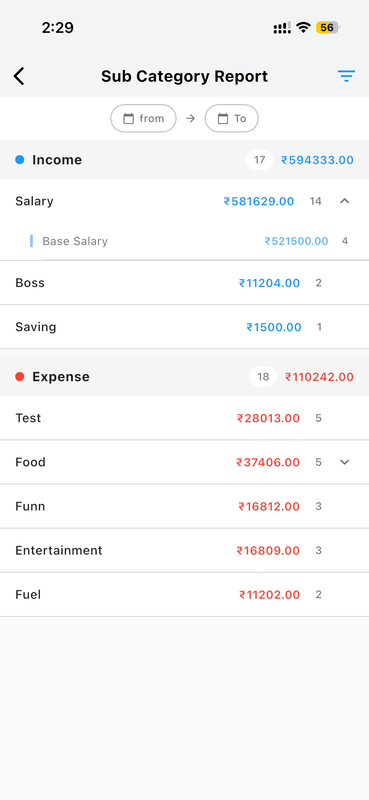
The Sub Category Report drills down deeper than standard category totals, breaking down both income and expense entries by their specific sub-categories for the most granular financial view available. Under Income (₹5,94,333 across 17 transactions), you can see Salary broken into Base Salary (₹5,21,500 from 4 entries), Boss (₹11,204), and Saving (₹1,500). Under Expense (₹1,10,242 across 18 transactions), categories like Test, Food (with an expandable sub-list), Funn, Entertainment, and Fuel are listed with exact totals and entry counts. This report is invaluable for understanding the fine-grained breakdown of your financial activity and spotting patterns within each major category over time.
Advanced Report Filters
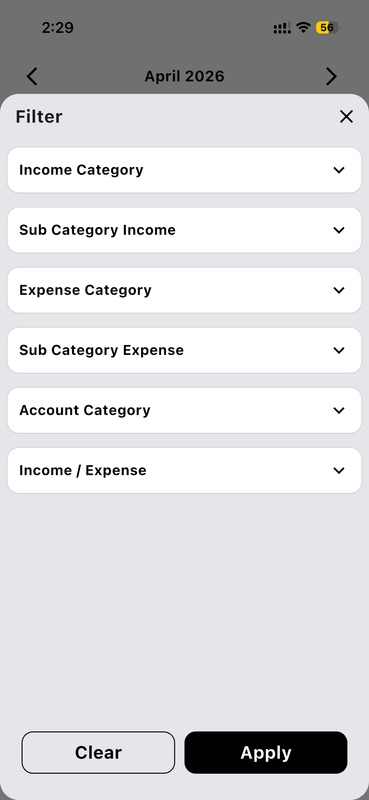
The Filter panel in Money Manager's Reports section gives you granular control over which transactions appear in your analysis. You can filter by Income Category, Sub Category Income, Expense Category, Sub Category Expense, Account Category, and by Income or Expense type — each presented as a collapsible dropdown for easy multi-selection. Apply any combination of these filters to narrow your report to exactly the transactions you want to analyze in depth. Tap Apply to update the report view instantly, or Clear to reset all filters back to the defaults. This powerful filtering system means you can slice and examine your financial data any way you need — by category, account, type, or any combination.
Category-wise Totals Report
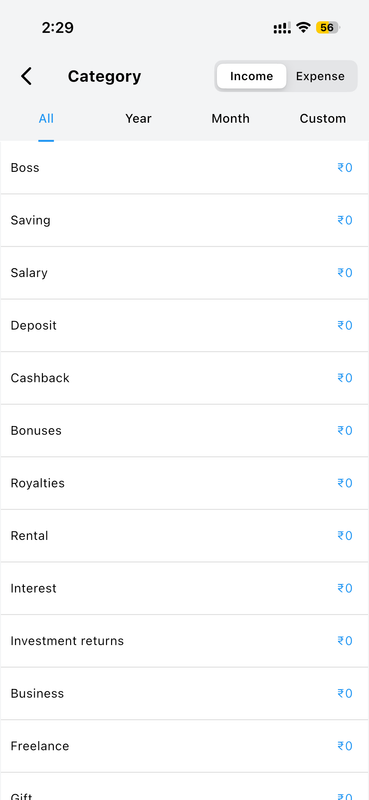
The Category screen in Reports lets you view your totals broken down by individual category for any time period — All time, Year, Month, or a Custom date range. Switching between Income and Expense tabs using the top toggle gives you separate views for your earnings and your spending independently. Income categories are listed alphabetically — Boss, Saving, Salary, Deposit, Cashback, Bonuses, Royalties, Rental, Interest, Investment Returns, Business, Freelance, Gift, and many more — each displaying its total balance for the selected period. This view is perfect for identifying which income sources or spending categories dominate your finances and how they compare across different time windows.
Transaction List with Export & Analytics
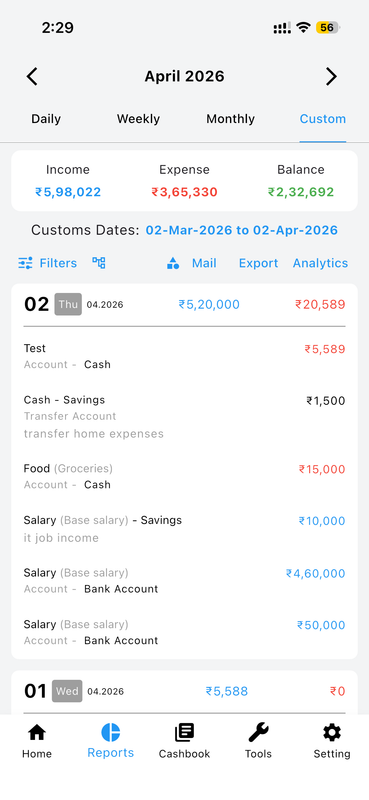
The main Reports transaction list shows all your entries organized by date with Daily, Weekly, Monthly, and Custom tab views. For each date group you can see the total income and expense for that day at a glance. Individual transactions show the amount, category, account, notes, and type. The toolbar above the list includes Filters (to narrow by category or account), a column view toggle, Mail (to email the report directly), Export (to save as Excel or PDF), and an Analytics shortcut. The Custom date range view — for example 02-Mar-2026 to 02-Apr-2026 — gives precise control over the period, with a full summary of Income (₹5,98,022), Expense (₹3,65,330), and Balance (₹2,32,692) displayed at the top.
Complete Transaction History
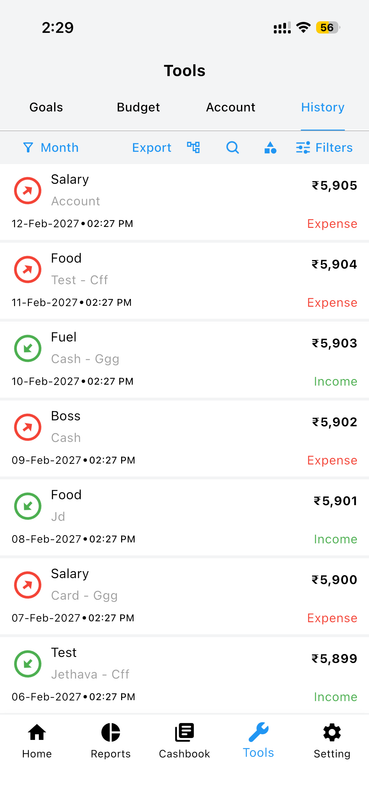
The History tab inside Tools provides a complete chronological record of every transaction ever entered in Money Manager, viewable by Month with full export and filter capabilities. Each history entry shows the transaction date and time, the category, account, note, and amount — color-coded green for Income and red for Expense for instant visual identification. Use the Export button to save the full history as a file, the search icon to find specific entries, the person icon to filter by payee, and the Filters button to narrow results by category or account type. This comprehensive log ensures you always have a complete, auditable trail of every single financial event ever recorded in the app.
How to Use Financial Reports
-
Open Reports Tap the Reports icon in the bottom navigation bar to access all analytics, category breakdowns, and transaction views.
-
Select a Date Range Choose Daily, Weekly, Monthly, or Custom tab to set the exact time period you want to analyze in your reports.
-
View Analytics Charts Tap the Analytics button to see interactive pie and donut charts breaking down your income and expenses by category for the selected period.
-
Apply Filters Use the Filter panel to narrow reports by specific category, sub-category, account, or transaction type to get the focused view you need.
-
Export or Share Tap Export to save your report as an Excel or PDF file, or tap Mail to send it directly to your email address for record-keeping or sharing.
Why You'll Love It
Understanding your finances requires more than just recording transactions — it requires seeing patterns, trends, and category breakdowns that reveal the true story of your money over time. Money Manager's Financial Reports deliver all of this with clarity and depth. From a quick pie chart overview to a detailed sub-category drill-down, from a filterable transaction list to a full exportable history — every report you could ever need is built in and beautifully presented.
Combined with Money Manager's real-time sync and cloud backup, your financial insights are always current, always accurate, and always accessible — giving you the complete picture you need to make smarter financial decisions every day.